 Most business owners and operators intuitively understand it costs much more to win business from a new customer than it does from an existing customer. Most everyone in business also knows that it's an expensive and involved process to win new customers.
Many statistics show that it generally costs at least 5x more to acquire a new customer than to keep an existing one. Furthermore, statistics also show that the probability of selling something to an existing customer are 60-70%, whereas the probability of selling to a new prospect is 5-20%.
All businesses should be consistently measuring and monitoring their customer churn and acquisition rates.
There's a very real customer acquisition cost (CAC) and, the higher the churn, then the lower the life time value (LTV) of customers and the lower the return that's earned.
This article is going to put these critical performance indicators into perspective for the typical small reseller of office products and supplies in the North American market.
Customer Churn Rate:
Churn is the amount of revenue a business turns over each year. For high unit cost product oriented companies, where customers buy once and don't buy again for a period of years, or perhaps ever, (i.e. autos), churn rates are very high - near 100%. For companies in recurring revenue businesses (i.e. office products and supplies) the churn rates, along with average order size, should be much lower.
The actual churn rate for a business can be calculated through determining the retention rate and subtracting from 100.
Put simply the formula for calculating churn is as follows:
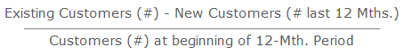
So, as an example, 150 customers minus six new = 144 divided by 160 = 90%
Subtract 90% from 100% means the annual churn rate = 10%
Most business owners are unfamiliar with this formula. If churn is calculated at all, then there's a tendency to believe it's calculated from a simpler formula that fails to account for any new customer acquisitions that took place during the preceding 12-month period.
For example 150 (current customer count) divided by 160 (customer count at start of 12-month period) = 93.75%. Subtract 93.75% from 100% = 6.25%. In this incorrect calculation for churn, new customer acquisitions are disguising the true churn rate of 10%.
For a business with 150 customers experiencing 10% churn it will have less than 100 customers within 4 years!
Market Shrink:
It's clear churn can be devastating to a business but, unfortunately, for the office products industry, it's even more of a problem when it's combined with market shrink.
Overall, the shrink in market size for office supplies is not that significant. It's a $25 billion market in retail dollars and it's shrinking at a little more than 1% per year. However, the real impact of shrink to the aftermarket is much more serious when you look at the segmentation between monochrome and color in the supplies market.
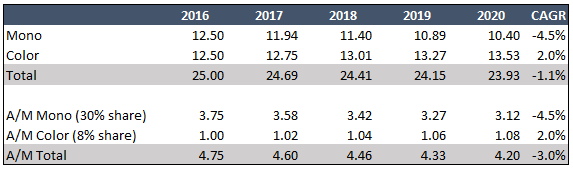
The aftermarket has a 30% share of monochrome and 8% share of color. The mono market is shrinking at nearly 5% per year and the color is actually increasing at around 2% per year.
Because the aftermarket has an unequal share of the two market segments and because its largest share is in the fastest contracting segment, its market is shrinking nearly 3X faster than the overall market.
Unless the aftermarket resellers can increase their share of the color market then they're facing a 3% annual market contraction that must be added to their customer churn rate.
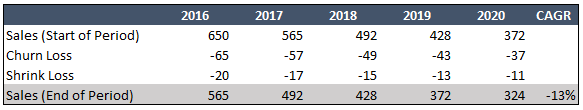
In the above example a reseller starting out 2016 with $650,000 in annual sales and a 10% churn rate is going to see its revenue halved by the end of 2020 when churn is combined with the weighted impact of market shrink.
To avoid this potentially devastating outlook, the churn rate must be reduced and the customer acquisition rate on new business (particularly color) must be increased.
For a comprehensive outlook on the prospects for the office products reseller click on the link below for a free copy of our eBook.

Customer Acquisition Rate:
Now, for businesses with high customer churn rates, it's quite likely they also have low customer acquisition rates. There's usually a reason for high churn - poor quality, inadequate value proposition, lack of customer engagement, poor market knowledge and intelligence, etc. These reasons for high churn are usually the same reasons why new customers can't be acquired.
Most of the time there's a high inverse correlation between churn and acquisition - as churn reduces, then acquisition increases and vice-versa.
It's simple to calculate your acquisition rate:
So, as an example, 150 customers minus six new = 144 divided by 150 = 96%
Subtract 96% from 100% means:
The annual acquisition rate = 4%
It should be clear, if you're a business with churn rates greater than your acquisition rates then your business is shrinking. By focusing on fixing the underlying causes for the high churn rates you can usually expect to increase your acquisition rates.
Customer Acquisition Cost (CAC):
How can we measure the customer acquisition cost? Like the other calculations I've explained above, it's simple when you know how.

So, as an example, sales expense divided by six new customers
($650,000 x 40% =$260,000) = Sales Expense
$260,000 / 6 = $43,333
In this example the CAC is $43,333
Life Time Value (LTV):
Now I've explained the methodology for calculating customer acquisition cost, it's possible to calculate the Life Time Value of a customer.
Step 1: Calculate the expected lifetime of the customer in years - this is easy, just divide the churn rate into one - i.e. 1 / 10% = 10 years
Step 2: Multiply the average customer revenue per year by the expected life time - i.e. $4,333 x 10 = $43,333
Step 3: Multiply the 10-year revenue by the average Gross Margin - i.e. $43,333 x 35% = $15,167
In this example the LTV is $15,167
So what does all this mean?
Well, it shouldn't take a genius to understand that a business is going to fail if its cost to acquire new customers ($43,333) is greater than its ability to monetize those customers ($15,167). As can be seen in Example 1 below, the CAC exceeds the LTV and the red line displays an "out-of-balance" business model.
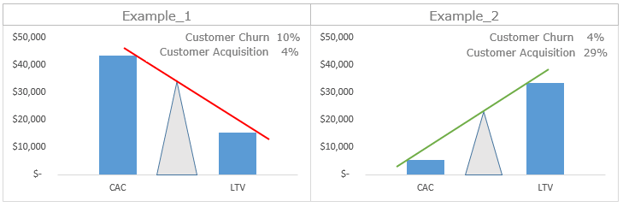
Now let's turn our attention to Example 2 shown in the chart above.
This chart has the same underlying assumptions as Example A except churn is reduced and acquisition is improved - remember, I already pointed out these two rates usually move inversely to each other. Put simply, by fixing the problems underlying the high churn rate, not only does churn come down but acquisition goes up!
In Example 2 churn is reduced to 4% and acquisition increased to 29%. As a result the Cost of Customer Acquisition decreases to $5,200 and the Life Time Value increases to $33,456. Now we have a great ratio between CAC and LTV as displayed by the green line signifying a sustainable business model!
The table below summarizes the data I've used for the explanation provided above.

Conclusions:
The "silent killers" of churn and shrink in the office products industry. The analogy from the health care industry and its constant reminder to us all of the dangers of high blood pressure is quite deliberate.
You can reduce blood pressure and live a lot longer by changing your life style. You can reduce churn and have your business survive a lot longer by fixing the underlying causes of customer churn in your business.
Of course quality, value and customer service are all vital for customer retention. But, there are other factors that increasingly come into play in our modern digital world that must also be taken into account.
-
Firstly, the traditional barriers to churn are being removed - fast!
-
To keep a customer in the modern digital environment you must join the digital environment.
-
There's almost unlimited choice available via the internet - but, once you have a customer, you've got to keep it.
-
So, you have to stay engaged with your customers to keep them and they must have trust and confidence in you.
-
They must see their supplier as an entity with authority in its field. Market intelligence is a key building block for establishing authority.
-
Suppliers using market intelligence earn trust and confidence that helps translate to loyalty and low churn.
-
Suppliers MUST engage with their customers with a mix of useful, relevant social media engagement as well as personal interaction.