I've wondered for a while just what is the point Tweeting and have a quandary to decide how much time and effort's required to figure out if it's worth participating on the Twitter platform at all. This has become a bit of a catch-22 because I'm busy but, I'm also an advocate for intelligent, objective use of social media in business. To resolve this, and because I can't afford to ignore the Twitter platform, I finally decided to invest more of my time to figure out if a consistent, ongoing effort may be likely to generate a positive return on investment.
My intent in this article is not specifically to be teaching anyone how to Tweet. Rather, I thought I'd relate my experiences from the past few weeks effort in the hope that it may resonate, with skeptics as well as promoters, and help them decide what role the Twitter platform could play in their own social media plans and strategies.
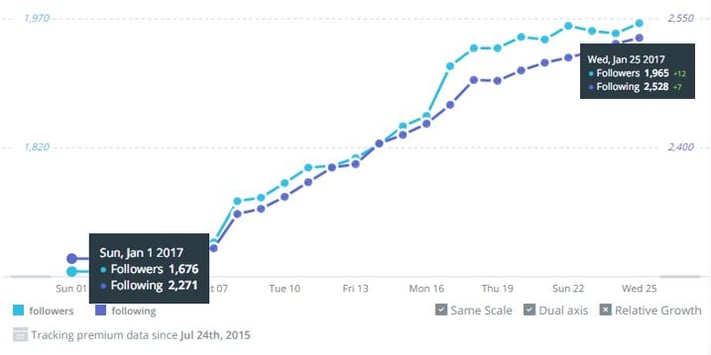
To begin, this is what my January 2017 looks like. As you can see, I started with 1,676 followers which, as of January 25, has increased by almost 300 (17%) to 1,965, while the number of accounts I'm following increased by 257 or 11% from 2,271 to 2,528.
So what does this mean, how much effort has it taken and does it look like it's going to be worth it?
First, what am I trying to accomplish?
Well, I have one primary objective which is to develop increased volumes of relevant traffic back to our website, with a view to converting a portion of that traffic into lead opportunities and, ultimately, some of those leads into customers.
I'm using two strategies to achieve this goal:
- Publishing curated content that's closely aligned with my strategy for motivating business transformation strategies in the office products reseller community and engaging with the audience interested in that material.
- Distributing our own content to the same audience and increase levels of engagement with that audience.
Let's take a closer look at a summary of my month-to-date Twitter activity.
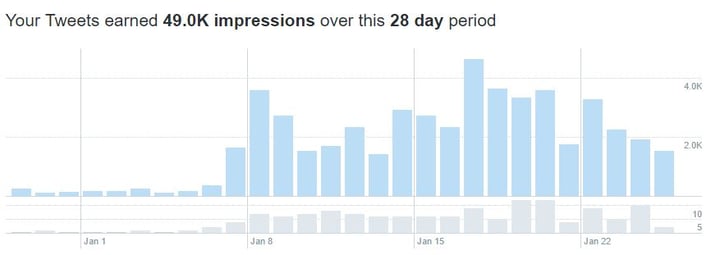
First thing you should see here is that within the 28 day period covered by the chart, my increased activity started on January 7. The total number of impressions (not called out within the image) from four Tweets published between December 29 and January 6 (nine days) was 1,687. Since January 7, I've published a further 125 Tweets and earned almost 48,000 new impressions.
What does this mean?
Firstly, my Twitter "reach". On January 7, I had 1,710 followers and on January 25, I had 1,965. Let's take the average of these two numbers [1,710 + 1,965 = 3,675 / 2 = 1,838]. So, the maximum number of impressions I could have obtained from 125 Tweets to an average of 1,838 followers [125 x 1,838] is equal to 229,750. My actual number of impressions was 48,000 so, my Twitter "reach" [48,000 / 229,750] equals 21%.
Now, I'm pretty happy with a reach of 21% especially as Buffer [for example], with 754,000 followers, expects each Tweet they publish to only reach around 4% of their followers. Right now, it seems, my reach is 5-times the rate they typically expect to see, which leads me to lament, if only I had 750,000 followers!
However, perhaps Buffer's typical reach of 4% is also something to do with the fact that they have Tweeted a staggering 341,000 times since October 2010. This is equivalent to 143 Tweets per day, non-stop for six and a half years (24/7)! Perhaps their audience no longer expects to see high-value content in each of their daily count of 143 Tweets and, if this is the case, then it may be a significant factor negatively impacting their reach!
Anyway, the thing is ... what's the value of an impression anyway? Unfortunately, on its own, not much but, let's take a deeper dive into my January month-to-date summary to explain how value can be created.
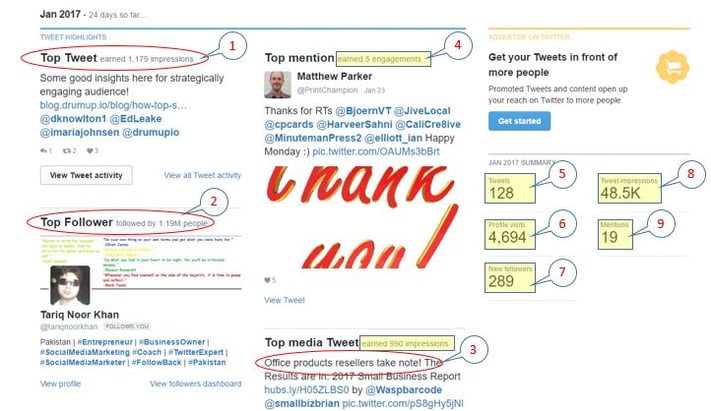 I'm going to explain each of the nine call-outs in the summary shown above.
- My top Tweet for January has 1,179 impressions, representing a reach of 64% of my average January audience. This Tweet contained high-quality, curated content I had judged would be of interest to my audience. Note also, my tactic to mention three contributors in the Tweet along with a mention of the blogging platform (DrumUpIO) that I discovered it on.
- My top new follower in January is my good friend Tariq Noor Khan with an audience of 1.19M followers. Now, with such a large audience, he's what's known as an influencer and I'm excited because (if I can engage him) he could really help me expand my audience for our digital services in the office products industry. Ha, if only! Unfortunately, as you may have suspected, he's not really my good friend, and he's not likely to be of much help to me. You can see he's an entrepreneur, business owner and a social media expert but, he's also located in Pakistan, not the United States, and probably doesn't have a passion for office products. Never mind, perhaps I (or someone else in our industry) will eventually become the Tariq equivalent!
- My top media Tweet (note "Office Products Resellers" is prominently placed within the Tweet) has so far earned almost 1,000 impressions, a reach of 54%. Not too bad ... perhaps my message resonated with a few of the office products resellers in my audience.
- My top mention, with five engagements, resulted from a conversation with Matthew Parker. This is my first mention of a "mention" or an "engagement", two important terms which, as I hope will become clear later in this article, make up the holy grail of Tweeting.
- January Tweets month-to-date = 128
- Profile visits = 4,694 - hmm, that's interesting - close to 5,000 times someone's been sufficiently interested in my Tweet to check out our Twitter profile which must represent some additional value to our brand.
- New followers month-to-date = 289 - I need to keep this level of audience building up for all of 2017 and see if I can hit 5,000 by the end of the year!
- 48,500 impressions. Now, in the 19 days since I ramped-up my activity that's an average of 2,600 impressions per day, equivalent to a current run rate of 80,000 impressions per month. So, if I keep this audience building effort up, then what value can I get out of the effort? I'll come back to this question at the end of this article, as this projection will form the basis of whether or not I'm prepared to continue to put in the time to expand and engage with my audience.
- Mentions = 19 hmm! Is this any good or what? Well, we'll see, I'll come back to this a little later as well.
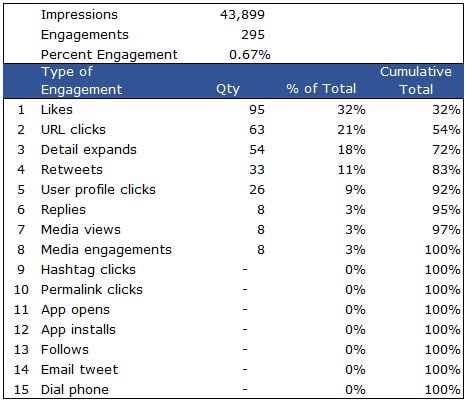
So, my average engagement rate for 19 days of activity in January is currently 0.67%. How does this stack-up and what does it mean?
On a deeper dive, I can see the impressions on my January Tweets are only 43,899 not 47,800. The discrepancy is accounted for by residual impressions earned on Tweets published prior to this 19-day period. So, for now I'm going to focus on my 295 engagements (0.67%) resulting from my 43,899 impressions.
Twitter currently has fifteen different types of engagements defined that I have also displayed in the table below. We can see that over 90% of my engagements came from five different types, with the largest component being "Likes" [a social media equivalent of a high-five!]. Each these different types of engagement have a different value - the more likes, the more other Twitter users are likely to engage with the Tweet, the more Retweets, the greater the audience amplification, the more URL clicks, the more the possibility those clicks may be leading back to our website, etc.
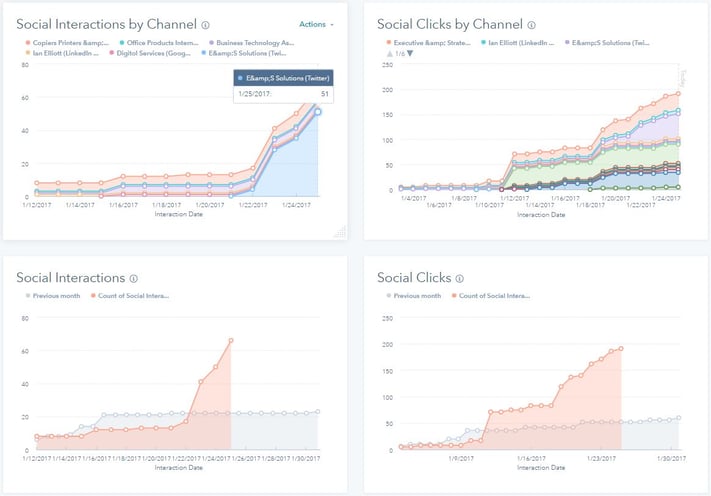
 Now take a look at the performance charts below where you can see some significant increases in both the social interactions and the social clicks by channel, that we have earned. The chart positioned top left in the sequence of images below, shows 51 of the 66 social interactions (77%) have come from Twitter. Note also, the time lag between my increased activity on January 7 and the spike starting on January 22.
If you look at the two charts showing the social clicks, then you can see an initial spike took place on January 11 but this was nothing to do with our Twitter activity, as it coincided with a blog published to a specific LinkedIn Group. However, a second spike took place on January 19 and has continued through January 25, and which is directly attributable to the Twitter activity. 26% of the social clicks occurring in January are now originating from Twitter.
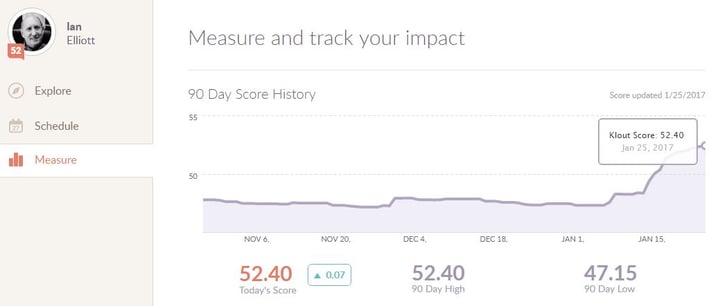
Now look at what took place with my Klout Social Authority Index Score. You can see from the image below, starting January 8, there was an initial spike, a leveling off, and then a sustained increase taking the score to its current 52.4 from a 90-day low of 47. Now, the Klout score is calculated on a logarithmic scale, where each incremental one-point increase is 10-times harder to achieve than the previous one-point increase. This has been a significant increase in my social authority and is a direct result of the increased activity and engagement on Twitter that's occurred during January.
"Remember, from a previous blog explaining social authority how more people will take notice of your content the greater your social authority. This increase in my Klout is indicative of the virtuous circle that develops as all these activities click into place!"
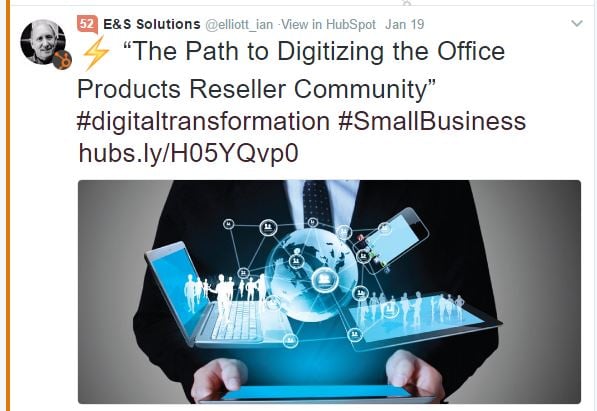
 Anyone who's already signed up for a [free] Klout account already knows it means their Index score then shows up on the Twitter feed. I have no doubts, based on my own experience, that Twitter users are strongly influenced with regards to, who to take note of and who to ignore, as is enabled by the Klout Index scores prominent display on the Twitter feed.
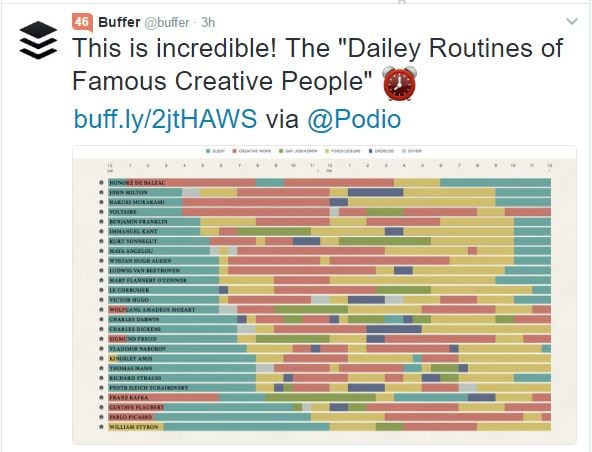
Not wishing to appear to be harping on negatively about Buffer (a fine organization in my opinion) but, take a look at their current Klout Index score of 46 as displayed on their Twitter feed. It just goes to show that although they have 750,000 followers, launch 140+ Tweets per day, have a 4% reach and 0.07% engagement, and may get large numbers of clicks compared to what we can achieve with a much smaller following, it doesn't seem to be doing as much for their social authority as I'm able to demonstrate we can build for ours!
I have not sought out one new follower during our recent spate of activity as, every new follower obtained in January, was a direct result of the content (Tweets) published during this period. All the new accounts we started following during January have been "follow-back's" on those that followed us, which is a markedly different strategy to the one we used back in August 2015.

You can see from the image above, in August 2015 I Tweeted 27 times [1] and earned 18,100 impressions [2]. My audience was smaller then but, the average number of impressions per Tweet was 670 compared to 380 in January 2017. Some of this difference may be accounted for because August 2015 represents a full month while January 2017 (on January 25) does not. This, however, is not the main point I wish to make. In August 2015 I was aggressively seeking followers. I was seeking out Twitter accounts that I considered may be relevant to us and, after following, a portion would follow me back - just like I've followed back 250 or so of the 300 that have followed me during the current month.
The more significant numbers in the August 2015 summary are found in the Profile Visits [3] and the Mentions [4]. With 4,619 Profile Visits, this represented over 25% of the 18,100 impressions earned and the 52 Mentions was almost two-times the number of Tweets published. Compare these numbers to January 2017 where 4,694 Profile Visits is less than 10% of the 48,100 impressions and 19 mentions are only 15% of the 128 Tweets published. These are significant differences and, if I had been able to maintain the ratios on these two KPIs [from August 2015 into January 2017], then we would have already obtained 12,000 Profile Visits and 250 or so Mentions this month.
It's clear to me, a more balanced audience development strategy, with a more equal effort applied to pro-actively seeking out additional audience members, [versus the passive "follow-back" strategy we adopted this month], would most likely have resulted in better metrics for both Profile Visits and Mentions. As both of these engagement metric are important to us, the aggressive "seek-out" strategy will be incorporated back into our future audience development efforts and run in parallel to the audience expansion we've achieved through distribution of a mix of relevant high-quality proprietary material alongside our curated content.
Learn more about a unique Digital Transformation Service - everything you need for a digital upgrade and the tools needed for developing new business with "Blue Ocean" caliber customers. Click on the link below to get started.
Conclusions:
As you may appreciate, not only have I spent a fair amount of time increasing our Twitter activity over the last few weeks, I've also spent time analyzing the results. The path I'm now on is to place all this into a business model to help us decide whether there's an acceptable return on investment for the costs incurred through continuing to Tweet at our current levels of activity.
This objective has been accomplished in the business model summary shown in the table below.
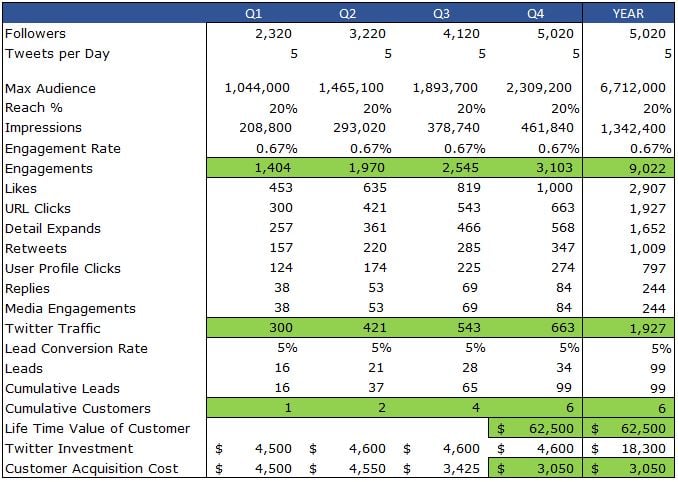 Using the same follower growth rate, the same reach percent, and the same engagement rate, as the actuals from January 2017, my business model shows I can expect 1.3 million impressions and 9,000 engagements to generate almost 2,000 site visits. Assuming a 5% conversion from visit to lead and 6% sales funnel conversion of leads to customers, then we're projecting to obtain six new customers in 2017 directly from our Twitter activity. The Life Time Value (LTV) of our typical customer is calculated at $62,500 and the Cost of Acquisition (CAC) at just over $3,000.
As I explained back in August 2016 in an article titled "The Silent Killers - Office Products, Market Shrink and Customer Churn", so long as the LTV is greater than the CAC, there's a sustainable business model.
"We have a projected ratio of 20:1 between the LTV and the CAC telling us, if we can execute on this plan, a Twitter strategy is well worth the investment."
The final point to note with all of this is that, besides the hour or so a day we have to invest to execute this Twitter social media plan, we've not yet considered the potential benefits of investing to boost the numbers by paying Twitter to expand our audience. I'm not going to go any further with that discussion in this article but, you can be sure I'll be coming back to explore this in a sequel to this paper, in the very near future.
Our "Great Office Supplies Caper" blog has a laser focus on the plight of office products dealers with material created to educate and motivate them for starting down the path of digital transformations. Although my case study experience relates to a different service and a different target audience (the resellers themselves) to the audience the resellers themselves target to sell office products and supplies to, I believe the Twitter experience recounted is directly relevant to resellers wondering what the point of Twitter may be.
Of course, the content that must be curated and created by resellers must be different to the content we use for our purpose. However, the resellers customers lifetime value and cost of acquisition should be in the same ballpark as ours so, modification of the message and application of the techniques described here, could lead to the resurrection of hundreds of currently dormant office products Twitter accounts. It seems, once the techniques have been mastered, Twitter has the potential to become a valuable social media marketing platform for B2B office products resellers.
If you missed my recent eight-part series on the office supplies aftermarket tipping point, please check out my new eBook, it's just published, it's FREE, and it contains a thorough examination of the office supplies industry and a path to the $20 billion growth opportunity for independent resellers.


