In part one of our assessment of the Xerox / Fuji Xerox deal, we asked the question whether or not the combination would be likely to make a difference. More specifically, what we meant was whether or not it would be likely to result in a single, stronger entity better equipped to compete in the global marketplace.
- Part I - Will the Fuji Xerox acquisition of Xerox make a difference?
- Part II - Where's the upside in the Fujifilm deal to combine Fuji Xerox and Xerox?
- Part III - Who, if anyone, is vulnerable to lose market share to the new Xerox?
In this, the second of a three-part series, we're taking a deeper dive into the market size, market segments, and market shares in order to frame up the challenge the new enterprise will face to grow revenues and overcome investor concerns.
Before we start our dive into the numbers, there are some straightforward points to keep in mind:
1. The markets that Xerox and Fuji Xerox operate in are mature and all the indications are, at least in aggregate, that they're shrinking.
2. In order to grow a business in a shrinking market you must increase market share.
3. There's a broad overlap of products and services offered by Fuji Xerox and Xerox so the immediate aftermath of the deal doesn't result in significant new products into new geographical markets.
4. As a result of the historical joint venture agreement, there's a clear delineation of geographical markets each operate in - i.e. Xerox and Fuji Xerox don't compete with each other.
5. The most commonly used indicator to judge a successful merger or acquisition is the future growth in sales and profits.
Our general take on the deal is that, while it's not difficult to believe there are synergies that may reduce costs ($1.25B targeted by 2020), it's more difficult to understand what the combination will do to help the new enterprise either protect its top line or increase its market share.
Xerox:
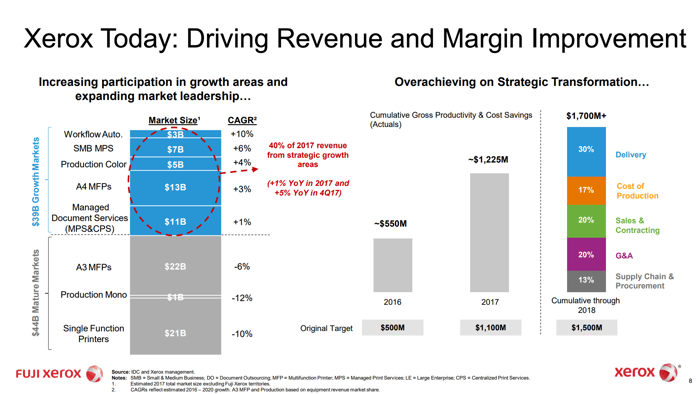
According to the Supplemental Transaction Information document provided by Fuji Xerox, the Xerox portion of the business competes in a $83 billion marketplace. As also disclosed in a footnote of the document, this $83B market is the addressable market represented by the geographical territories Xerox has operated in under the terms of the joint venture agreement.
Xerox separates this $83B market into two sections:
1. $44B Mature Markets (currently 60% of revenue)
2. $39B Growth Markets (currently 40% of revenue)
In aggregate, Xerox appears to expect its sales in the mature market sector to decline at a CAGR of 8% per year between 2016 and 2020 and their sales in the growth market sector to increase at an average rate of 3.7% per year.
Source: Xerox Supplemental Transaction Information document
This means, in aggregate, if all Xerox does is maintain their existing market shares, then their revenues will decrease at an average rate of 3% per year. Therefore, based on current sales of $10.26B, sales will decline by nearly 10% to $9.4B by 2020.
In other words, the growth sectors of the market Xerox participates in are not growing fast enough to offset the declines in the mature sectors of their market. So, there's no way Xerox can grow the top line unless they increase market share.
Fuji Xerox:
Again, referencing the Supplemental Transaction Information document it's interesting to note:
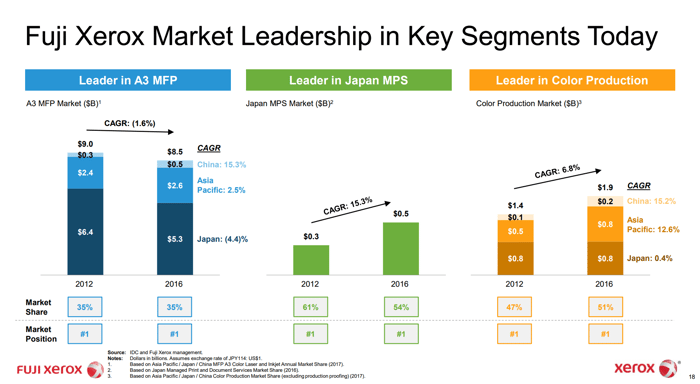
1. $8.5B of 2016 sales are from the A3 MFP segment and have declined at an average of 1.6% per year between 2012 and 2016. The total market is estimated at $24.3B of which Fuji Xerox has an estimated 35% share.
Note: $1.7B of these sales are effectively inter-company transactions representing sales of Fuji Xerox manufactured equipment to Xerox and must be eliminated when assessing the future financials for the combined entities.
2. $0.5B of 2016 sales are from Japanese sales in MPS and Document Management Services and have grown at 15.3% CAGR since 2012. However, the total market is estimated at less than $1B and Fuji Xerox already has 54% share.
3. $1.9B of 2016 sales came from the Color Production segment and have grown at 6.8% CAGR since 2012. Total market size is estimated at $3.7B, of which Fuji Xerox claims a leadership position with a 51% share.
Source: Xerox Supplemental Transaction Information document
These numbers are very interesting as they disclose the existing market share positions in each of the three revenue categories. Interesting because, the larger the existing market share, the harder it becomes to continue to increase market share and grow revenue in the future.
1. Over 85% of current sales are coming from the A3 MFP market where Fuji Xerox sales have declined at a CAGR of 1.6% despite holding on to a 35% share of the market since 2012. In other words the overall market is declining.
2. It seems unlikely that a 15% CAGR can be sustained in the Japanese MPS market or a 7% CAGR in the Color Production market when greater than 50% share of each of these markets has already been captured. Furthermore, even though Fuji Xerox sales have increased in the Japanese MPS market, their market share has decreased. In other words, despite a 15%+ CAGR between 2012 and 2016, market share has fallen from 61% to 54% as Fuji Xerox sales must have grown less quickly than the market.
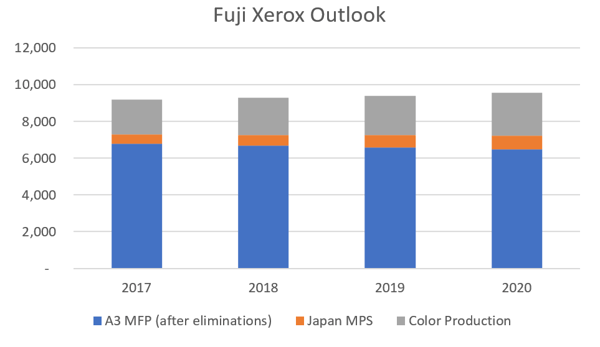 Based on our interpretation of the details in the presentation document, it appears management believes the two growth sectors may be just large enough to compensate for the market shrink taking place in the A3 MFP sector and could lead to a slight increase in revenue from $9.2B (FY17) to $9.56B by 2020.
However, four years of projecting less than 2% average revenue decline in the A3 MFP market, when it's more likely the market is shrinking 5-6% per year, means the Fuji Xerox market share must increase from 35% to 40%.
Finally, to achieve four years of 15% compound annual growth in the Japanese MPS market (assuming the market doesn't get any bigger) means Fuji Xerox would have to increase its share from 54% to 77%.
Fuji Xerox and Xerox - The Combined Outlook
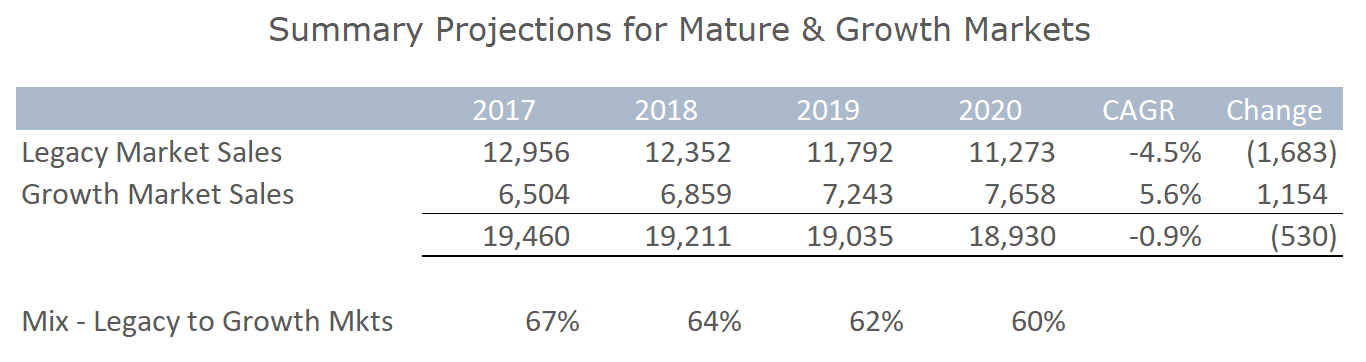
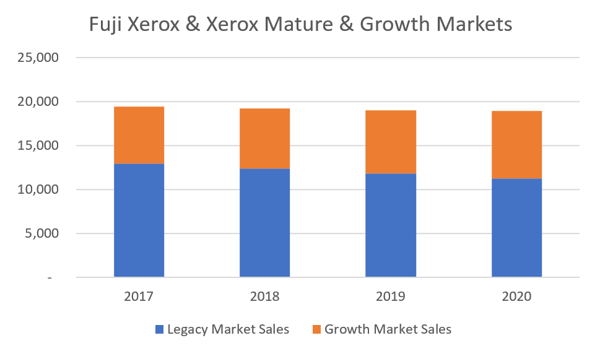 This chart represents the projected combined sales of Xerox and Fuji Xerox and shows a decrease of around 1% per year between 2017 and 2020 from $19.46B to $18.93B. The chart also shows a change in mix between Mature and Growth markets from 67/33 (2017) to 60/40 (2020). However, despite the projected mix improvement, there will still be a heavy dependency on mature markets through 2020, markets where there's more likely to be an increased decline as time marches on. This likelihood of market decline increases the risk of revenue shortfalls which may be greater than anticipated.
 Source: Xerox Supplemental Transaction Information document
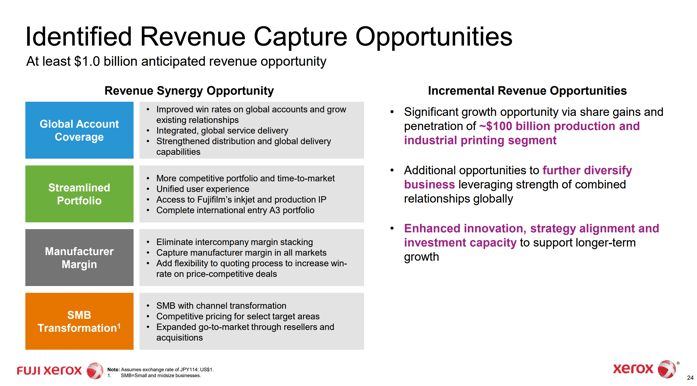
In the final extract (above) we've taken from the Supplemental Information Document, management have broadly identified "at least $1 billion anticipated revenue opportunity". While we can see a way to reconciling $1.1B of growth opportunity based on our interpretation of the information available, we don't see where the disclosure document accounts for a potential loss of $1.7B in revenue resulting from shrink expected to take place in the mature sectors of their business.
Based on our analysis, we think the new Xerox revenue outlook is likely to result in flat to moderate decline over the next three years or so with a downside risk of more significant decline.
Conclusions:
1. Xerox revenue has recently been shrinking at around 5% per year.
2. Fuji Xerox FY16 sales revenue was $10.3B and their 9 months FY18 YTD revenue is $6.9B which, pro-rated for 12 months, equates to $9.2B. Should this turn out to be their FY18 number then, between FY16 and FY18 a 5% per year decline has taken place at Fuji Xerox as well as at Xerox.
3. Apart from dividing their markets between mature (declining) and growth (increasing) markets, there are no disclosures of new products or new channels to support stronger growth.
4. Assuming the new Xerox is able to contain revenue loss to 1% per year (debatable) then it's still not likely to satisfy investors currently supporting a 13X share price to earnings ratio.
5. Assuming something in the order of 5% profitable sales growth per year is required to satisfy investors, then sales in the three years to 2020 would need to be nearly 20% ($3.6B) higher at $22.5B compared to the $18.9B we see in our analysis.
At this stage of our assessment, there's nothing obvious to suggest the proposed deal to combine the two companies will do anything to transform either of them. Beyond some advantages of scale and combination synergies, our current view is that the combined entities will face similar challenges as the independent ones.
In the upcoming third and final part of this series, we'll take a look at the competition to try and identify weak spots that could be exploited by Xerox to help take an incremental $3B in market share by 2020.
Make sure you don't miss out on the third and final installment - use the button below to sign-up for our blog!

The challenges created by the changing business conditions are no different for a big business like Xerox and a smaller business like a dealer reselling Xerox products. Big or small, a digital transformation strategy is necessary to survive. See where you stand in your digital transformation by downloading our Analog Vs. Digital evaluation template.